We previously featured Google Map Maker and 10 other tools to help you build maps. However, if you prefer using Javascript libraries instead, have we got the post for you.
Here are the JS libraries you can use to show special map markers, draw custom route lines or even show a dialog when you hover or click on certain points of the map.
Personalize your maps in the style that you want — some of them can be styled with CSS — or customize your map to be as interactive as you like. The source of the map data, dependencies and licenses of each library has been included for your convenience. (Source: hongkiat)
GMaps
GMaps makes adding and customizing Google Maps a breeze. Aside of adding a map, you can also a couple of things into the map, such as polylines which may be useful for drawing a route, a special menu control, and even HTML elements.
GMaps is compatible with JSON formatted data which you can utilize to integrate your map with a particular app, like Foursquare.
- Map Data Source: Google Maps
- Dependencies: none
- License: MIT License

jHere
At 5KB, jHERE shows you that size doesn’t matter; you can still build a powerful interactive map with a handful of customization options. jHERE derives map visualization from HERE map, which is one of the most popular map providers for Windows Phone.
The library can be extended with new functionality, and there are a couple of extensions developed for this library including one for adding shapes, routes, and custom markers.
- Map Data Source: HERE Maps
- Dependencies: jQuery or ZeptoJS
- License: MIT License

Kartograph
Kartograph comprises of two files, Kartograph.ph to generate the map in SVG format, and Kartograph.js to add interactive elements on top of the map. Since Kartograph.js is built on top of Raphael.js the map would work nicely down to IE7. You can have a look at the interactive map demos to discover what Kartograph can do.
- Map Data Source: Kartograph
- Dependencies: Kartograph.py, Raphael, and jQuery
- License: AGPL and LGPL

Mapael
jQuery Mapael allows you to create maps with elegant data visualization as well as interactivity. You can, for example, create a map and designate each region on the map with different colors based on region. You can also add tooltip on the region, as well as event handlers like click or hover.
The map is built with SEO in mind by providing alternate content for search engine robots that are not capable of crawling JavaScript-generated content.
- Map Data Source: Raphael.js
- Dependencies: jQuery
- License: MIT License

D3js
D3.js is a comprehensive JavaScript library that will bring your data to life through HTML, SVG and CSS. D3 use is quite varied including for building a highly interactive map. See this map of World Bank Global Development and you will see the possibilities of what you can build with D3.js.
- Map Data Source: D3.js
- Dependencies: none
- License: Undefined

DataMaps
If building a map with D3.js is overwhelming, you can use DataMaps. DataMaps is essentially a D3.js plugin that is developed specially to build maps. It inherits many of the capability of D3.js, hence you can build simple or very customized maps with it. Did I mention that the map is responsive?
- Map Data Source: D3.js
- Dependencies: D3.js and TopoJSON
- License: MIT License

GeoChart
GeoChart is a simplified Google Map that renders region, markers, and text, instead of a full-fledged map with tiny details. The map is generated in SVG, and can be customized in many ways including changing the region colors, adding popup, and custom map markers.
- Map Data Source: Google Maps
- Dependencies: none
- License: Read Google Maps TOS

Maplace
Maplace, a jQuery plugin for generating map through the Google Maps API v3. Maplace works in all browsers, including IE6. So this is another great plugin worth of your attention if you want to build map in the easiest way possible.
- Map Data Source: Google Maps
- Dependencies: jQuery
- License: MIT License

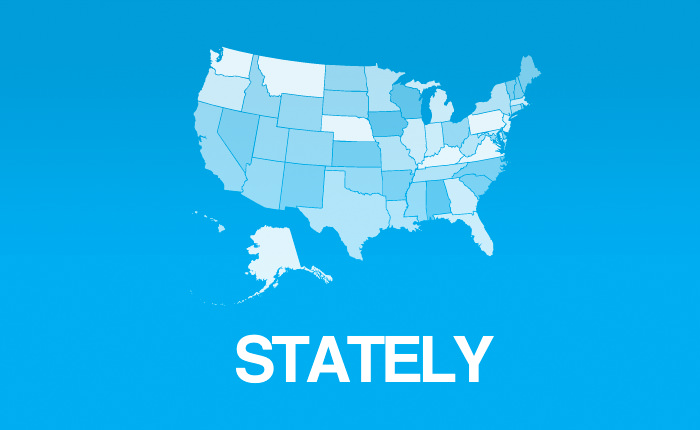
Stately
Stately is JavaScript library that is developed to generate US maps. The library is comparably lightweight considering that you can add interactive elements on top of your generated maps.
- Map Data Source: Stately / SVG
- Dependencies: none
- License: MIT License
GeoComplete
GeoComplete is a distinct JavaScript library on its own. The library will add an input field along with the map, which will show suggestions of cities, countries or states as you type.
- Map Data Source: Google Maps
- Dependencies: jQuery
- License: MIT License

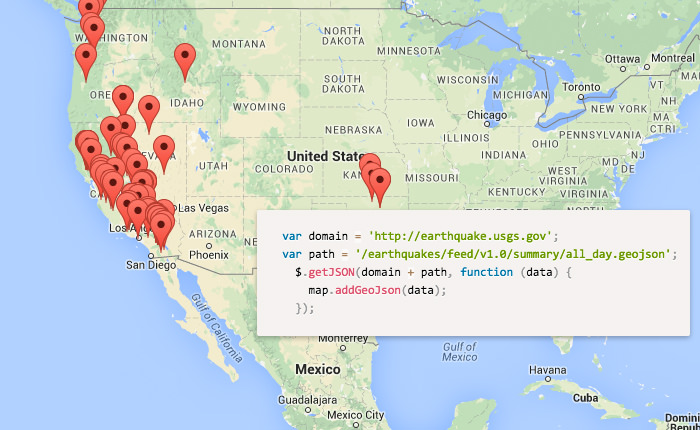
Map Tools
Map Tools provides intuitive API to add Google Maps. It supports loading of geo-formatted JSON data such as TopoJSON and GeoJSON to render the map. On top of that, you can add animated markers that I think will make the map more lively, insert HTML content with variables or placeholders ala Handlebars.
- Map Data Source: Google Maps
- Dependencies: GeoJSON / TopoJSON
- License: MIT License
OpenLayers
OpenLayers is a high performance open source JavaScript framework to build interactive maps using various mapping services. You can choose the map layer source using tiled layer or vector layer from a number of map services.
OpenLayer come mobile ready out of the box, suitable for building maps across devices and browsers. You can use CSS for a different look of your map.
- Map Data Source: OpenStreetMap
- Dependencies: none
- License: Undefined

Leaflet
Developers gave Leaflet basic functions to work perfectly, keeping its size small, perfect for mobile devices. For specific functions, just extend Leaflet using plugins.
Leaflet has most online map features you need: tile layers, popup, markers, and free vector layers like polylines, polygons, circles or rectangles. It comes with nice default designs although you can customize the style using CSS3 with ease.
Leaflet has the most usage interaction features both for mobile and desktop browsers.
- Map Data Source: OpenStreetMap
- Dependencies: none
- License: Undefined

 !
!