What is R?
R is a programming language developed by Ross Ihaka and Robert Gentleman in 1993. R possesses an extensive catalog of statistical and graphical methods. It includes machine learning algorithms, linear regression, time series, statistical inference to name a few. Most of the R libraries are written in R, but for the heavy computational tasks, C, C++ and Fortran codes are preferred.
R is not only entrusted by academics, but many large companies also use R programming language, including Uber, Google, Airbnb, Facebook and so on.
Data analysis with R is done in a series of steps; programming, transforming, discovering, modeling and communicating the results
- Program : R is a clear and accessible programming tool
- Transform : R is made up of a collection of libraries designed specifically for data science
- Discover : Investigate the data, refine your hypothesis and analyze them
- Model : R provides a wide array of tools to capture the right model for your data
- Communicate : Integrate codes, graphs, and outputs to a report with R Markdown or build Shiny apps to share with the world
In this tutorial, you will learn-
- What is R used for?
- R by Industry
- R package
- Communicate with R
- Why use R?
- Should you choose R?
- Is R difficult?
What is R used for?
- Statistical inference
- Data analysis
- Machine learning algorithm
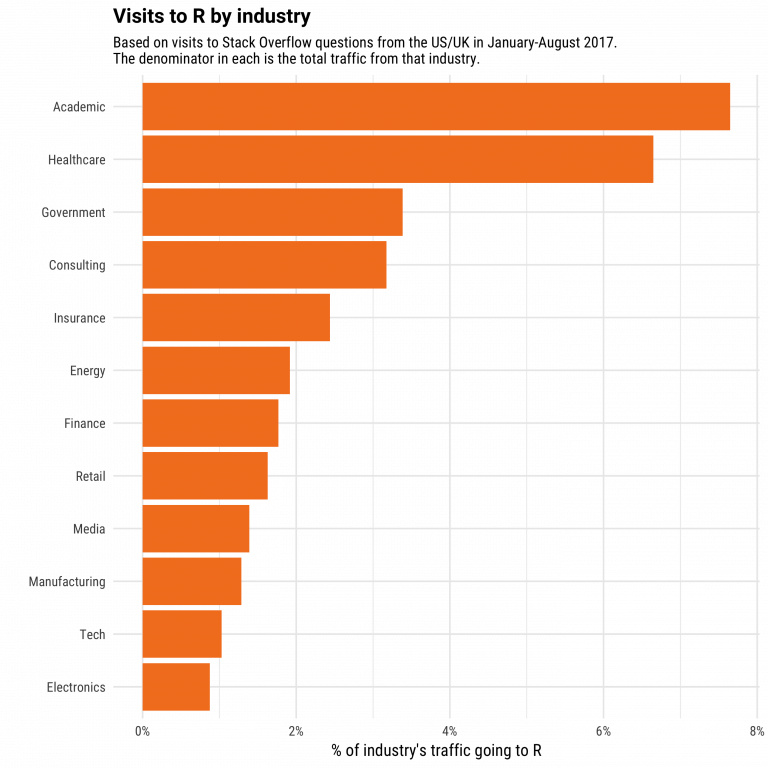
R by Industry
If we break down the use of R by industry, we see that academics come first. R is a language to do statistics. R is the first choice in the healthcare industry, followed by government and consulting.
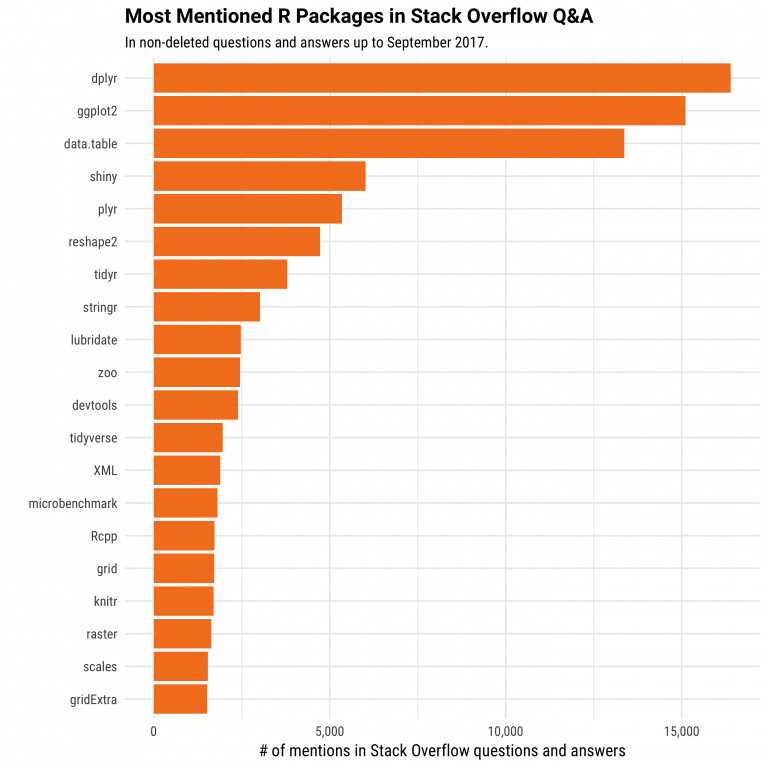
R package
The primary uses of R are and will always be, statistics, visualization, and machine learning. The picture below shows which R package got the most questions in Stack Overflow. In the top 10, most of them are related to the workflow of a data scientist: data preparation and communicate the results.
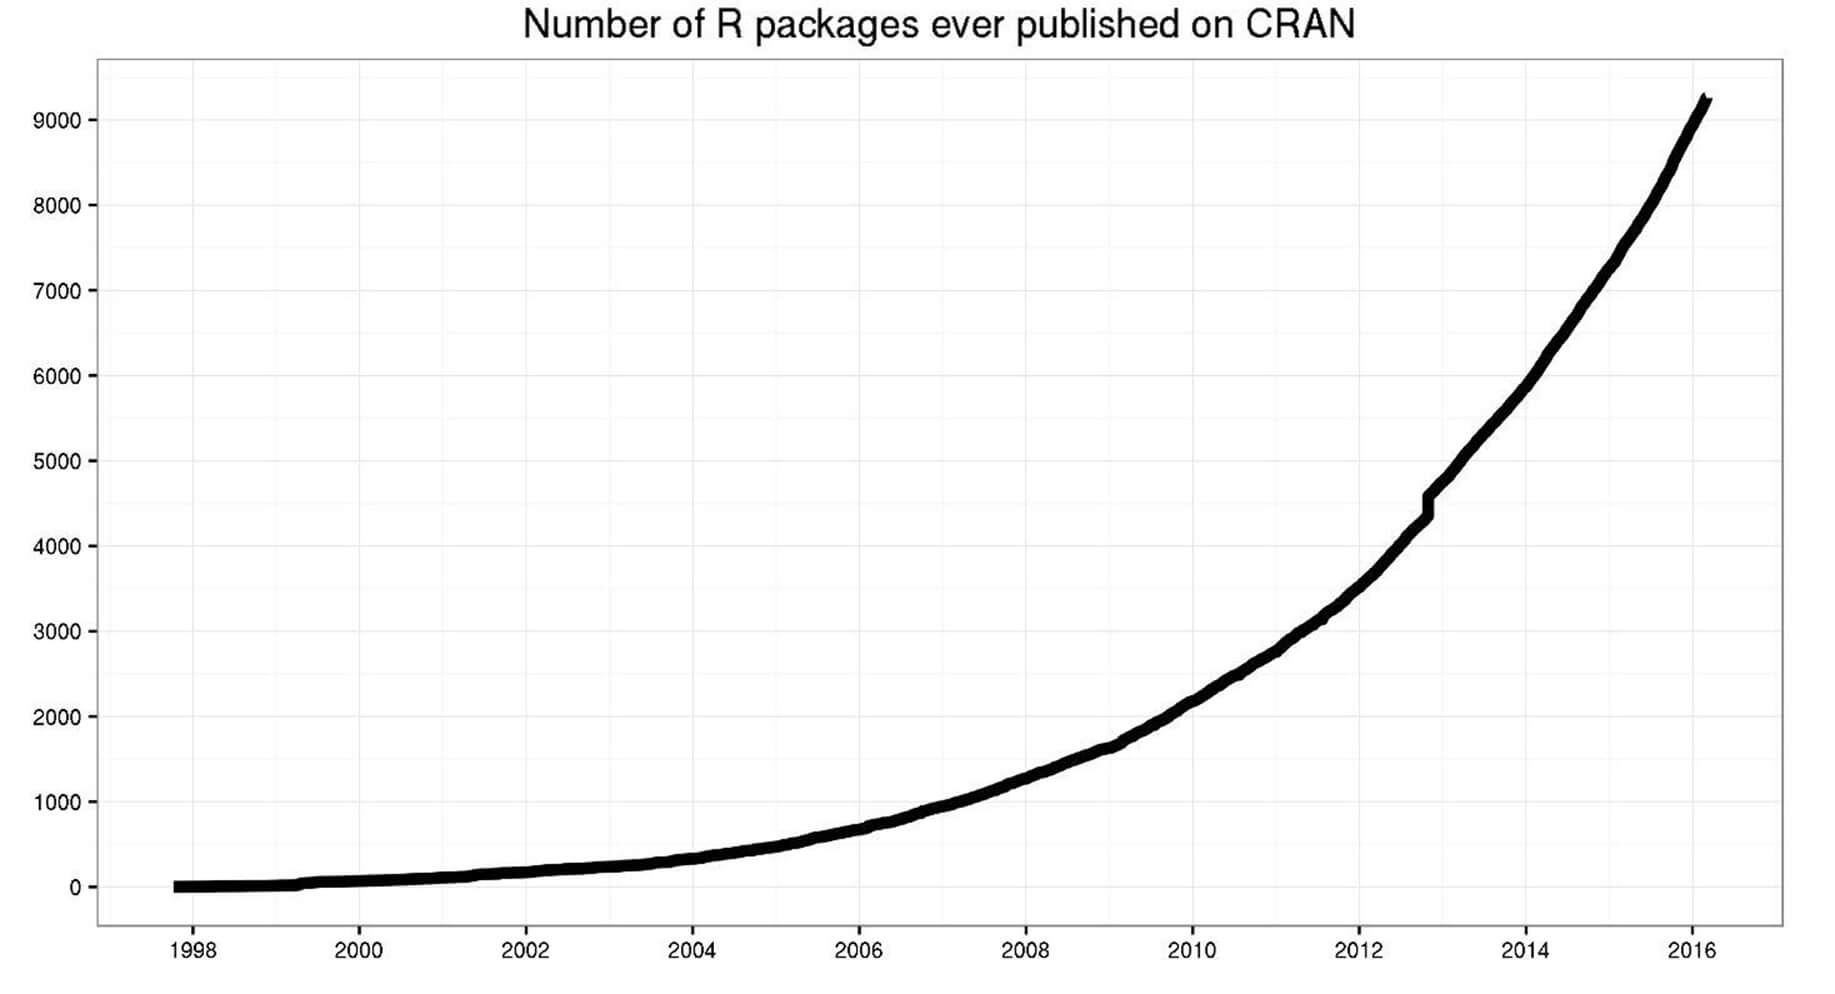
All the libraries of R, almost 12k, are stored in CRAN. CRAN is free and open-source. You can download and use the numerous libraries to perform Machine Learning or time series analysis.
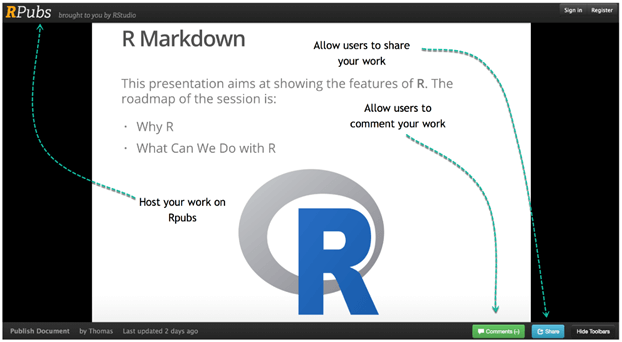
Communicate with R
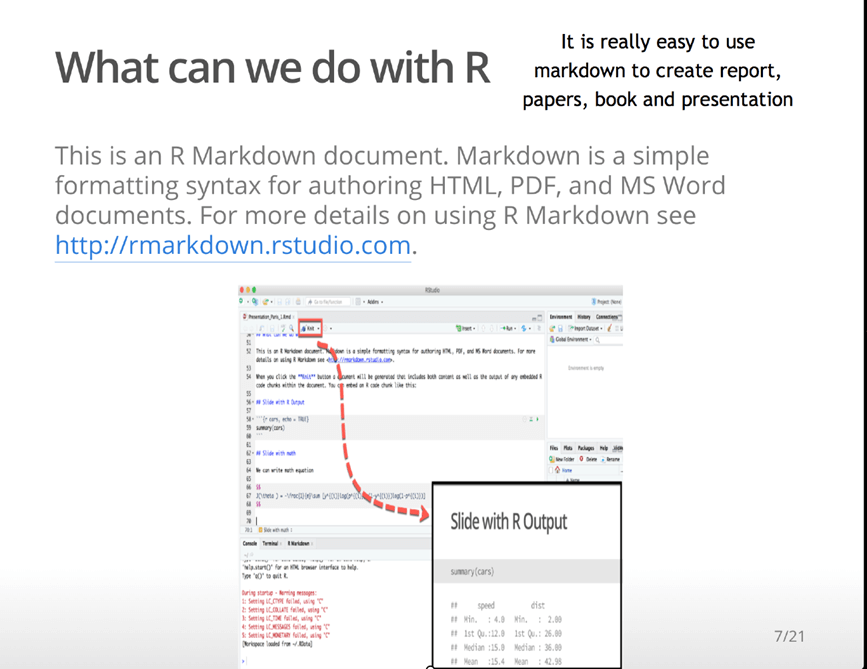
R has multiple ways to present and share work, either through a markdown document or a shiny app. Everything can be hosted in Rpub, GitHub or the business’s website.
Below is an example of a presentation hosted on Rpub
Rstudio accepts markdown to write a document. You can export the documents in different formats:
- Document :
- HTML
- PDF/Latex
- Word
- Presentation
- HTML
- PDF beamer
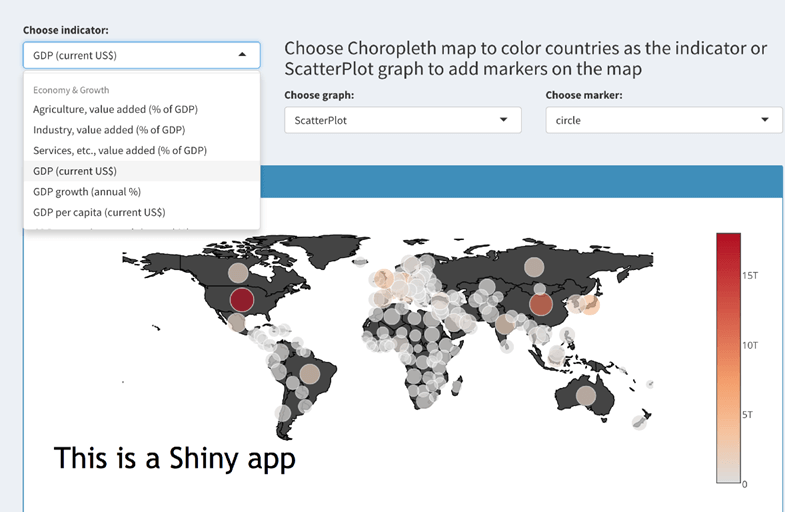
Rstudio has a great tool to create an App easily. Below is an example of an app with the World Bank data.
Why use R?
Data science is shaping the way companies run their businesses. Without a doubt, staying away from Artificial Intelligence and Machine will lead the company to fail. The big question is which tool/language should you use?
They are plenty of tools available in the market to perform data analysis. Learning a new language requires some time investment. The picture below depicts the learning curve compared to the business capability a language offers. The negative relationship implies that there is no free lunch. If you want to give the best insight from the data, then you need to spend some time learning the appropriate tool, which is R.
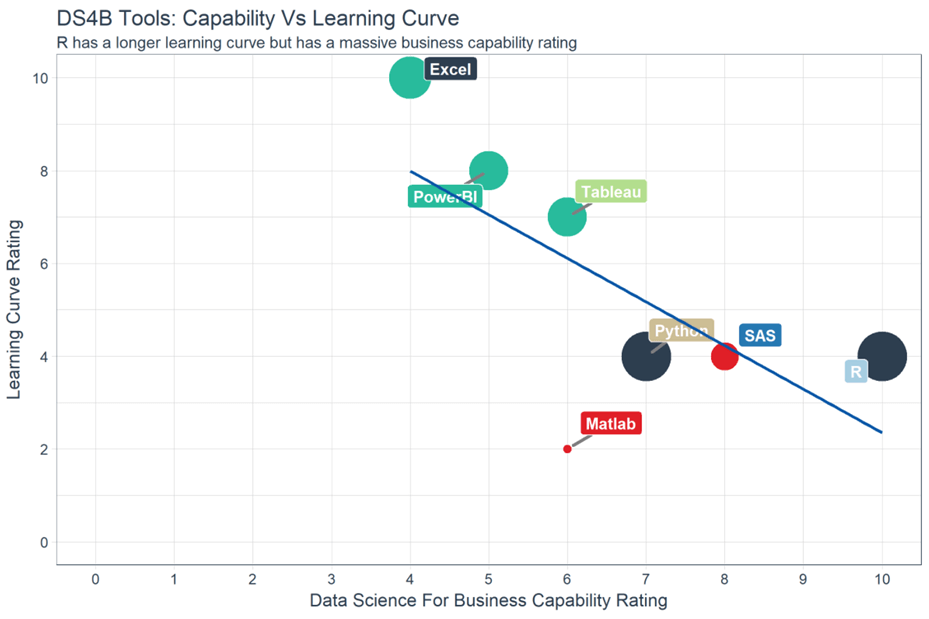
On the top left of the graph, you can see Excel and PowerBI. These two tools are simple to learn but don’t offer outstanding business capability, especially in terms of modeling. In the middle, you can see Python and SAS. SAS is a dedicated tool to run the statistical analysis for business, but it is not free. SAS is a click and runs the software. Python, however, is a language with a monotonous learning curve. Python is a fantastic tool to deploy Machine Learning and AI but lacks communication features. With an identical learning curve, R is a good trade-off between implementation and data analysis.
When it comes to data visualization (DataViz), you’d probably heard about Tableau. Tableau is, without a doubt, a great tool to discover patterns through graphs and charts. Besides, learning Tableau is not time-consuming. One big problem with data visualization is you might end up never finding a pattern or just create plenty of useless charts. A tableau is a good tool for quick visualization of the data or Business Intelligence. When it comes to statistics and decision-making tools, R is more appropriate.
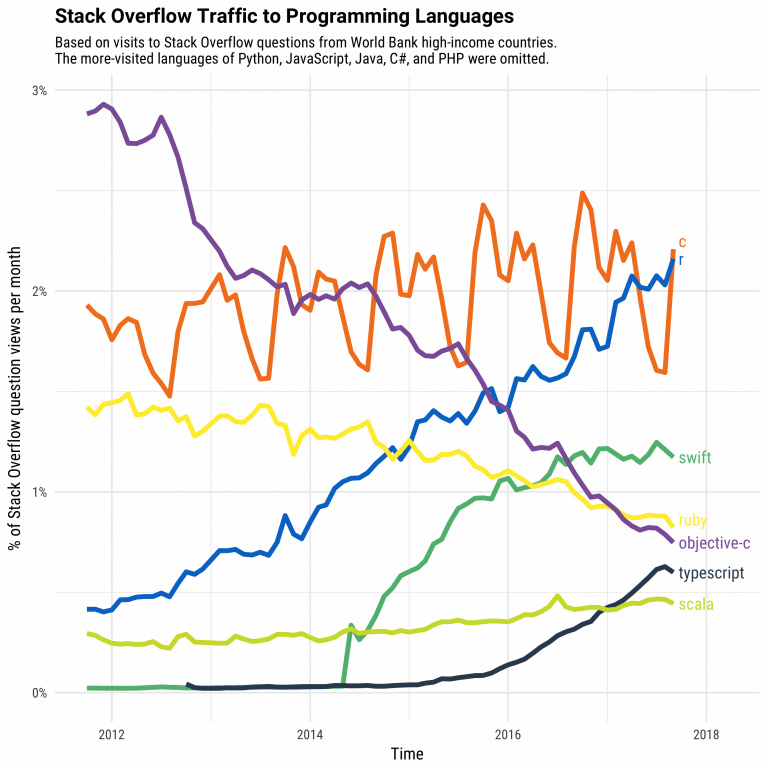
Stack Overflow is a big community for programming languages. If you have a coding issue or need to understand a model, Stack Overflow is here to help. Over the year, the percentage of question-views has increased sharply for R compared to the other languages. This trend is of course highly correlated with the booming age of data science but, it reflects the demand of R language for data science.
In data science, there are two tools competing with each other. R and Python are probably the programming language that defines data science.
Should you choose R?
The data scientists can use two excellent tools: R and Python. You may not have time to learn them both, especially if you get started to learn data science. Learning statistical modeling and algorithm is far more important than to learn a programming language. A programming language is a tool to compute and communicate your discovery. The most important task in data science is the way you deal with the data: import, clean, prep, feature engineering, feature selection. This should be your primary focus. If you are trying to learn R and Python at the same time without a solid background in statistics, it’s plain stupid. Data scientists are not programmers. Their job is to understand the data, manipulate it and expose the best approach. If you are thinking about which language to learn, let’s see which language is the most appropriate for you.
The principal audience for data science is a business professional. In business, one big implication is communication. There are many ways to communicate: report, web app, dashboard. You need a tool that does all this together.
Is R difficult?
Years ago, R was a difficult language to master. The language was confusing and not as structured as the other programming tools. To overcome this major issue, Hadley Wickham developed a collection of packages called tidyverse. The rule of the game changed for the best. Data manipulation becomes trivial and intuitive. Creating a graph was not so difficult anymore.
The best algorithms for machine learning can be implemented with R. Packages like Keras and TensorFlow allow to create high-end machine learning techniques. R also has a package to perform Xgboost, one of the best algorithms for Kaggle competition.
R can communicate with the other language. It is possible to call Python, Java, C++ in R. The world of big data is also accessible to R. You can connect R with different databases like Spark or Hadoop.
Finally, R has evolved and allowed the parallelizing operations to speed up the computation. In fact, R was criticized for using only one CPU at a time. The parallel package lets you perform tasks in different cores of the machine.
Summary
In a nutshell, R is a great tool to explore and investigate the data. Elaborate analysis like clustering, correlation, and data reduction are done with R. This is the most crucial part, without a good feature engineering and model, the deployment of the machine learning will not give meaningful results.